rm(list=ls())
library(ggplot2)
# if (!requireNamespace("BiocManager", quietly = TRUE))
# install.packages("BiocManager")
# BiocManager::install("ggtree")
#install.packages("ggtree")
library(ggtree)
library(ape)
#library(xtable)
#install.packages("treeio")
library(treeio)
#install.packages("sde")
library(sde)
##################################################################
# https://guangchuangyu.github.io/ggtree-book/chapter-ggtree.html
#####################################
#plot tree using path space
PlotTreeHistory<-function(phy=phy,pathdata=pathdata,main=main,colors=colors){
#pathdata=oubpathdata
ntips<-length(phy$tip.label)
edge.number<-dim(phy$edge)[1]
start<-rep(0,length(edge.number))
end<-rep(0,length(edge.number))
mtx<-(cbind(phy$edge,ceiling(phy$edge.length)+1,start,end))
mtx<-mtx[dim(mtx)[1]:1,]
colnames(mtx)<-c("anc","des","step","start","end")
mtx<-as.data.frame(mtx)
mtx$start[1:2]<-1
mtx$end[1:2]<-mtx$step[1:2]
for(edgeIndex in 3:dim(mtx)[1]){
mtx$start[edgeIndex] <- mtx$end[mtx$anc[edgeIndex]==mtx$des]
mtx$end[edgeIndex] <- mtx$end[mtx$anc[edgeIndex]==mtx$des]+mtx$step[edgeIndex]-1
}
ylim<-c(1, max(mtx$end) )
unlistpath<-unlist(pathdata)
xlim<-c(min(unlistpath),1.2*max(unlistpath))
plot(NA,xlim=xlim,ylim=ylim,xlab="Trait value", ylab="Times Steps",main=main,frame.plot=FALSE,yaxt='n',xaxt='n',ann=FALSE)
points(pathdata[[1]][1] ,1, lwd=2,pch=2,col= 1,cex=1.5)
for(edgeIndex in 1:edge.number){
path<-unlist(pathdata[edgeIndex])
points(path,mtx$start[edgeIndex]:mtx$end[edgeIndex], type="l",lwd=2,col=colors[edgeIndex])
points(path[length(path)],mtx$end[edgeIndex]:mtx$end[edgeIndex], cex=1.5,lwd=2,
pch=c(16,16,16,16,16,16)[edgeIndex],col=c("black","black","black", "black","black","black", "black","black")[edgeIndex])#,col=colors[edgeIndex])
}
}#end of plot history
#Ornstein Uhlenbeck bridge
oub<-function(Theta, a=0,b=0,t0=0,T=1,N=100){
alpha<-Theta[1]
theta<-Theta[2]
sigma<-Theta[3]
if(T<=t0){stop("wrong times")}
dt<-(T-t0)/N
t<-seq(t0,T,length=N+1)
d<-expression(-1*x)#alp
s<-expression(2)#sigma=2
X<-sde.sim(X0=a,drift=d,sigma=s,N=N)
Lambda<-exp(-alpha*(T-t))-exp(-alpha*(T+t))
Lambda<-Lambda/(1-exp(-2*alpha*T))
oubpath<-X-Lambda*(X[N+1]-b)
oubpath<-as.numeric(oubpath)
return(oubpath)
}
condOU<-function(Theta,phy=phy,tips=tips){
alpha<-Theta[1]
theta<-Theta[2]
sigma<-Theta[3]
n<-length(phy$tip.label)
m<-dim(phy$edge)[1]+1
covmtx<-sigma^2/2/alpha*exp(-alpha*dist.nodes(phy))
cov22 <- covmtx[1:n,1:n]
cov11<-covmtx[(n+1):m,(n+1):m]
cov12<-covmtx[1:n,(n+1):m]
inv_cov22 <-solve(cov22)
condmean <- theta + t(cov12)%*%inv_cov22%*%(tips-rep(theta,n))
condvar <- cov11 - t(cov12)%*%inv_cov22%*%cov12
return(list(condmean=condmean,condvar=condvar))
}
oubtree<-function(Theta,phy=phy,tips=tips){
#anclist<-condOU(Theta=Theta,phy=phy,tips=tips)
#fullnodedata<-c(tips,anclist$condmean)
anclist<-ace(x=tips,phy=phy)
fullnodedata<-c(tips,anclist$ace)
anc<-phy$edge[,1]
des<-phy$edge[,2]
ntips<-length(phy$tip.label)
edge.number<-dim(phy$edge)[1]
edge.length<-phy$edge.length
pathdata<-list()
for(edgeIndex in edge.number:1){
brlen<-edge.length[edgeIndex]
N<-ceiling(brlen)
b<-fullnodedata[des[edgeIndex]]
a<-fullnodedata[anc[edgeIndex]]
assign(paste("path",edgeIndex,sep=""),oub(Theta,a=a,b=b,t0=0,T=brlen,N=N))
pathdata<-c(pathdata, list(get(paste("path",edgeIndex,sep=""))) )
}
return(pathdata)
}
######################################
################ Main ################
######################################
treetext = "((A:0.25[&&NHX:],B:0.25[&&NHX:]):0.75[&&NHX:],((D:0.3[&&NHX:], E:0.3[&&NHX:]):0.2[&&NHX:B=],C:0.5[&&NHX:]):0.5[&&NHX:D=])[&&NHX:];"
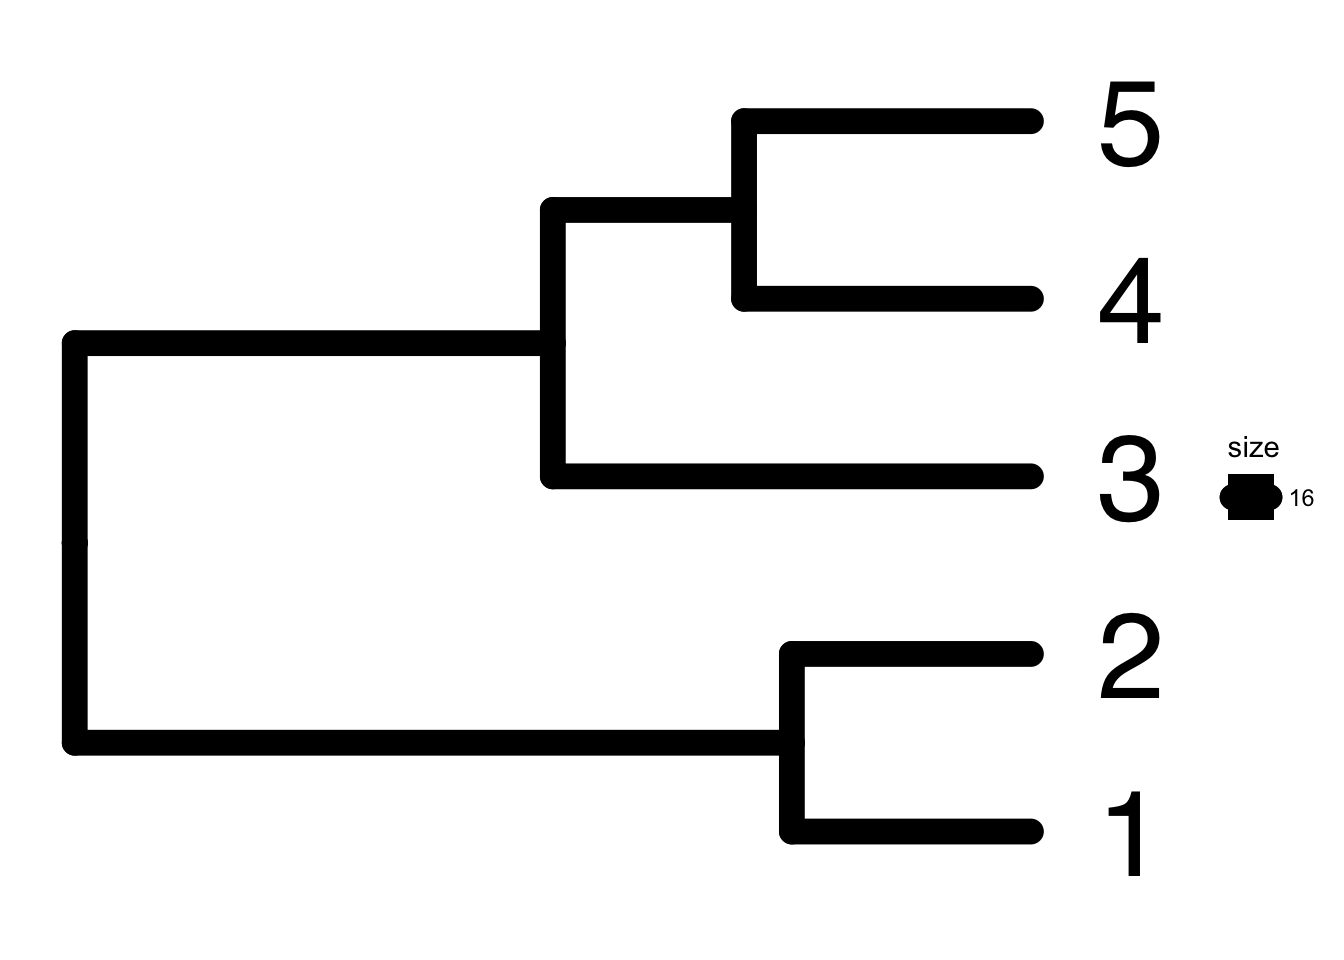
treetext = "((1:0.25[&&NHX:],2:0.25[&&NHX:]):0.75[&&NHX:],((4:0.3[&&NHX:], 5:0.3[&&NHX:]):0.2[&&NHX:B=],3:0.5[&&NHX:]):0.5[&&NHX:D=])[&&NHX:];"
tree <- read.nhx(textConnection(treetext))
ggtree(tree, aes(size = 16 )) +
geom_tiplab(size=16, offset=0.1, hjust=0.5) + geom_label(aes(label=D,fontsize=16), fill='black', vjust=0.75) +
geom_text(aes(label=B,fontsize=16))#+ coord_flip() #+geom_treescale(x=0,y=4.5,fontsize = 10,linesize=4)
Theta=c(0.01,mean(tips),1) #(alp,theta,sigma)
oubpathdata<-oubtree(Theta,phy=phy,tips=tips)
colors<-c("red","blue","orange","purple","black","brown")
par(mfrow=c(1,3))
par(mar=c(2,2,1,1))
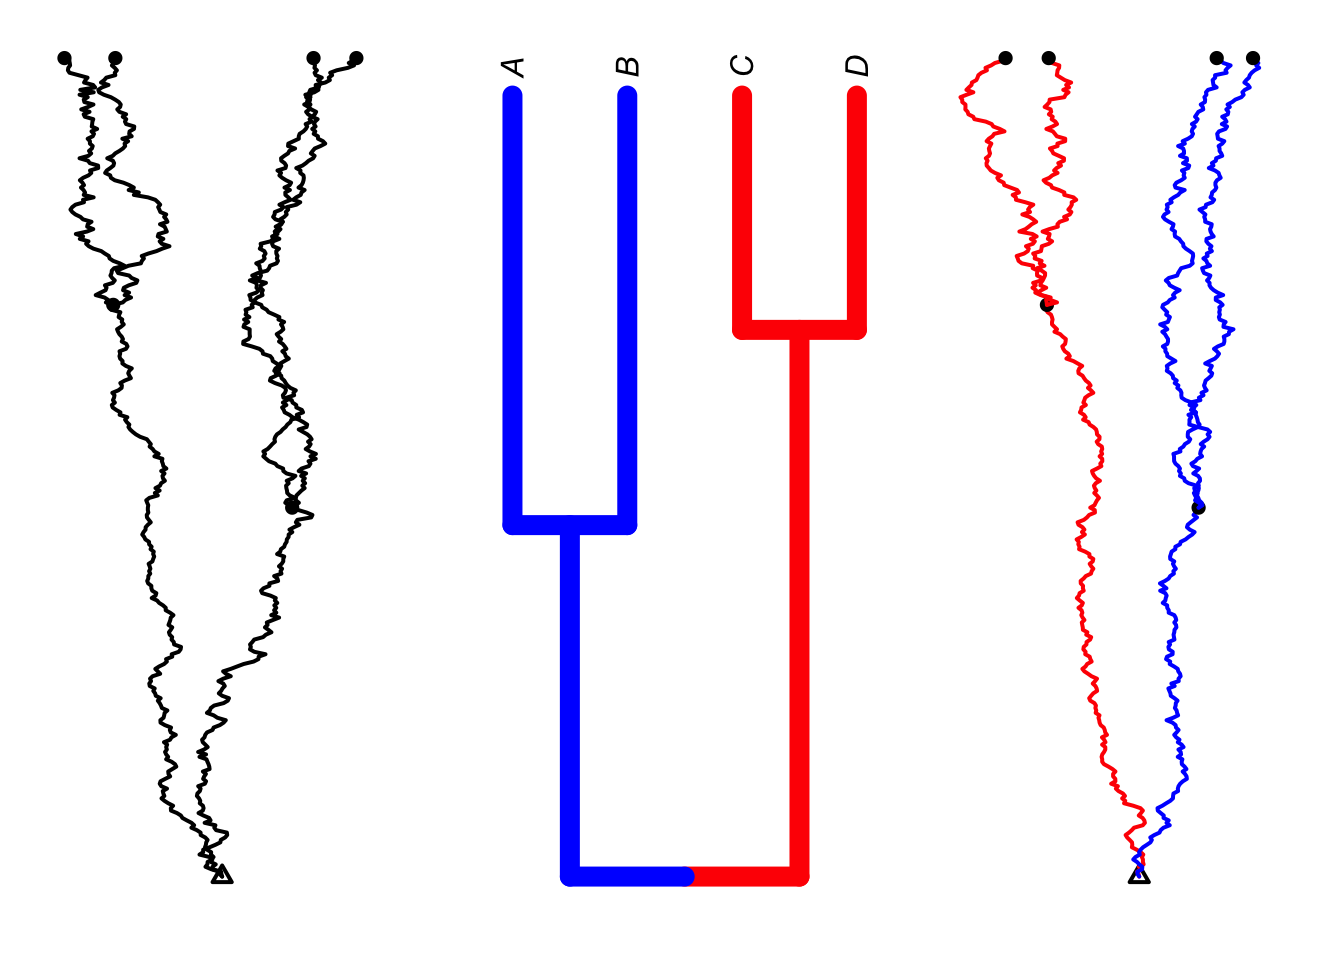
PlotTreeHistory(phy=phy,pathdata=oubpathdata,main="Trait Change",colors=rep("black",length(colors)))
colors<-c("red","blue","blue","blue","red","red")
plot(phy,edge.width=10,cex=1.5,edge.color=rev(colors),direction="upward")
set.seed(23922)
## OUB tree
tips<-c(9.8,8.2,-1.1,0.8)
anclist<-ace(x=tips,phy=phy)
anclist$ace