rm(list=ls())
library(phytools)
library(kableExtra)
library(phangorn)
mtx <- read.table("~/Dropbox/NSCT/112年計畫113年八月/phyNB2reg/rcode/mtxEOV-2.txt")
mtx<-as.matrix(mtx)
mtx<-mtx +t(mtx)
diag(mtx)<-1
D<- 2*(max(mtx)- mtx)
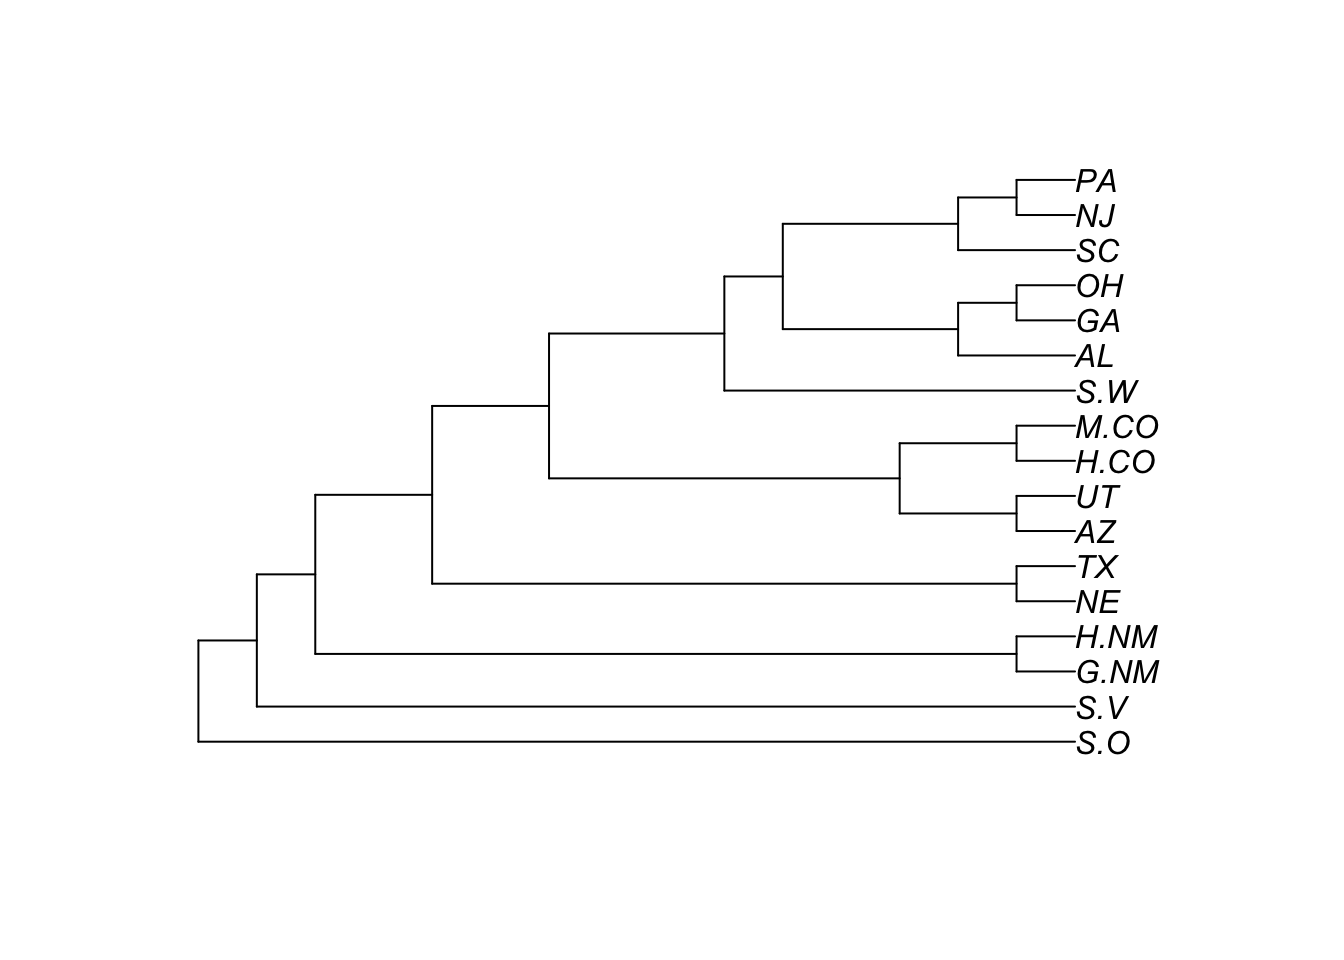
tree<-upgma(D)
tree$tip.label <- c("S. undulatus(GA)","S. undulatus(OH)","S. undulatus(AL)","S. undulatus(NJ)","S. undulatus(PA)","S. undulatus(SC)","S. woodi","S. undulatus(AZ)","S. undulatus(UT)","S. undulatus(Huerfano.CO)","S. undulatus(Mesa.CO)","S. undulatus(NE)","S. undulatus(TX)","S. undulatus(Grant.NM)","S. undulatus(Hidalgo.NM)","S. virgatus","S. occidentalis")
tree$tip.label <- c("GA","OH","AL","NJ","PA","SC","S.W","AZ","UT","H.CO","M.CO","NE","TX","G.NM","H.NM","S.V","S.O")
plot(tree)
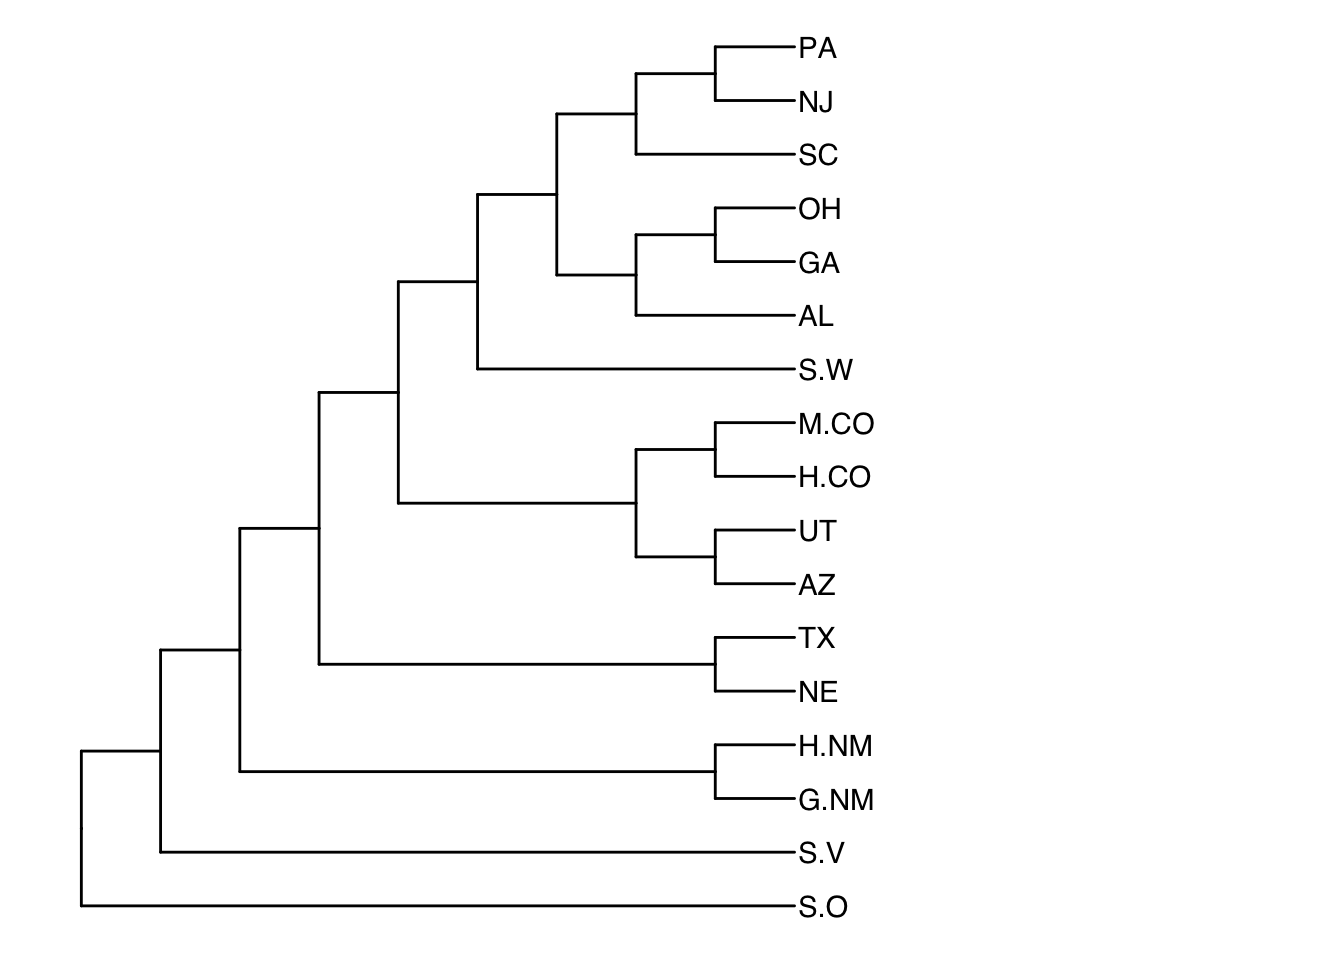
library(ggtree)
ggtree(tree, branch.length="none")+ geom_tiplab()+xlim(0, 15)
traitset<-read.table("~/Dropbox/NSCT/112年計畫113年八月/phyNB2reg/rcode/traitEOV-2.txt")
traitset<-as.data.frame(traitset)
colnames(traitset)<-c("SM","AS","AM","EM","CS","CM","EPY")
rownames(traitset)<-tree$tip.label
#head(traitset)
traitset %>%
  kable("html") %>%
  kable_styling()
| |
SM |
AS |
AM |
EM |
CS |
CM |
EPY |
| GA |
52 |
62 |
12.0 |
0.33 |
7.6 |
2.51 |
22.8 |
| OH |
66 |
75 |
20.0 |
0.35 |
11.8 |
4.13 |
23.6 |
| AL |
60 |
72 |
12.0 |
0.28 |
8.3 |
2.32 |
24.9 |
| NJ |
60 |
73 |
20.0 |
0.36 |
8.9 |
3.20 |
17.8 |
| PA |
62 |
72 |
22.0 |
0.42 |
11.0 |
4.62 |
22.0 |
| SC |
55 |
63 |
12.0 |
0.33 |
7.4 |
2.44 |
22.2 |
| S.W |
47 |
54 |
10.5 |
0.25 |
4.1 |
1.02 |
12.3 |
| AZ |
60 |
65 |
11.5 |
0.29 |
8.3 |
2.41 |
24.9 |
| UT |
58 |
69 |
22.8 |
0.36 |
6.3 |
2.27 |
18.9 |
| H.CO |
62 |
72 |
20.5 |
0.32 |
10.8 |
3.46 |
21.6 |
| M.CO |
58 |
70 |
20.5 |
0.42 |
7.9 |
3.32 |
15.8 |
| NE |
45 |
55 |
9.5 |
0.23 |
5.5 |
1.27 |
11.0 |
| TX |
47 |
57 |
12.0 |
0.22 |
9.5 |
2.09 |
28.5 |
| G.NM |
53 |
63 |
18.0 |
0.29 |
7.2 |
2.09 |
21.6 |
| H.NM |
54 |
68 |
12.0 |
0.24 |
9.9 |
2.38 |
39.6 |
| S.V |
47 |
57 |
10.0 |
0.23 |
9.5 |
2.18 |
9.5 |
| S.O |
70 |
84 |
22.0 |
0.50 |
11.2 |
5.60 |
11.2 |
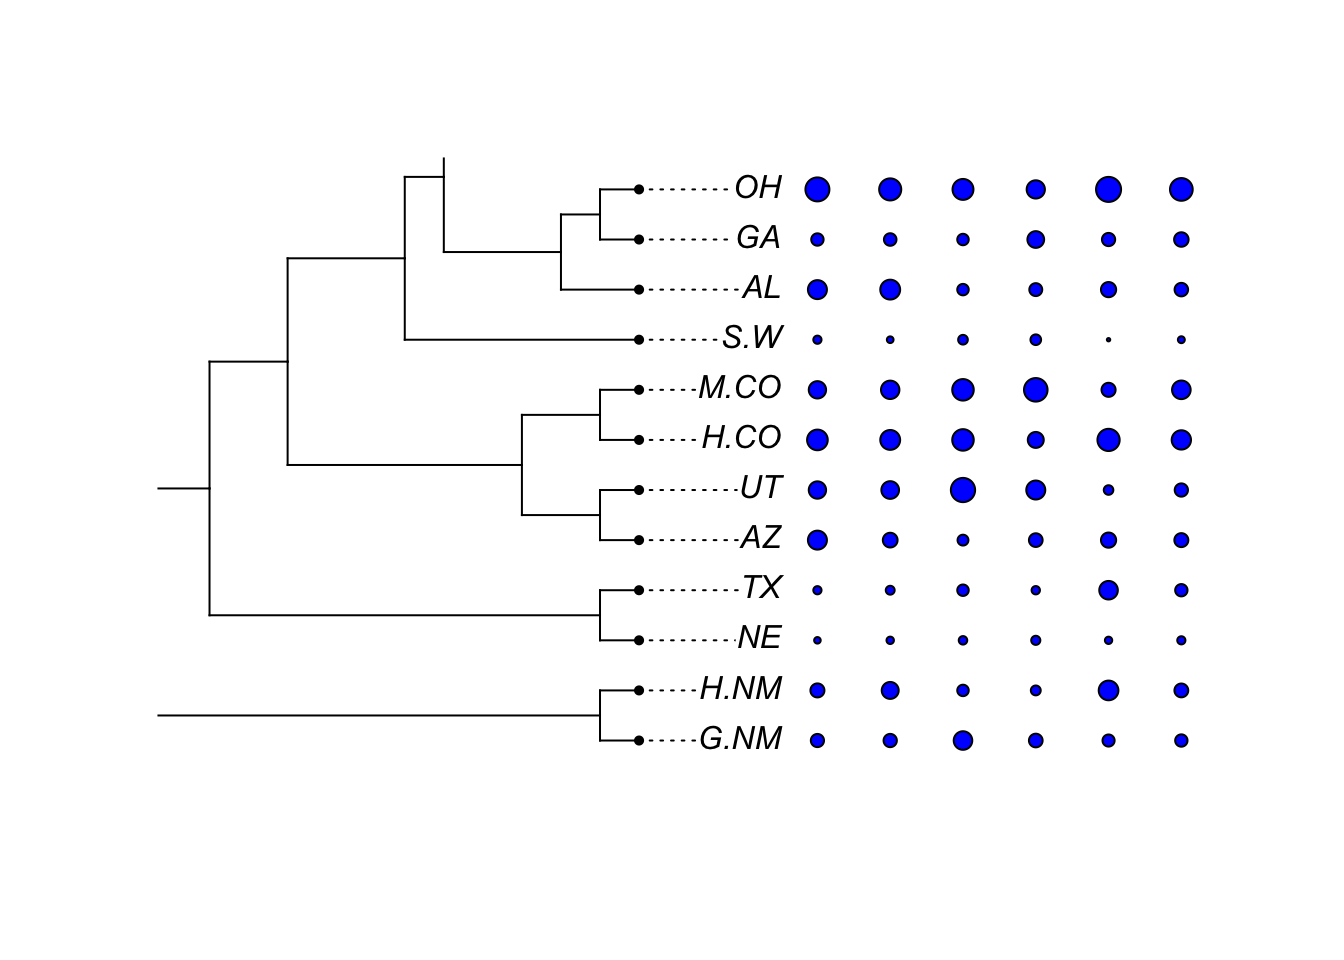
traitset$EPY<-round(traitset$EPY)
traitset<-traitset[c("PA","NJ","SC","OH","GA","AL","S.W","M.CO","H.CO","UT","AZ","TX","NE","H.NM","G.NM","S.V","S.O"),]

dotTree(tree,traitset[, colnames(traitset)!="EPY"],standardize=TRUE,length=10)
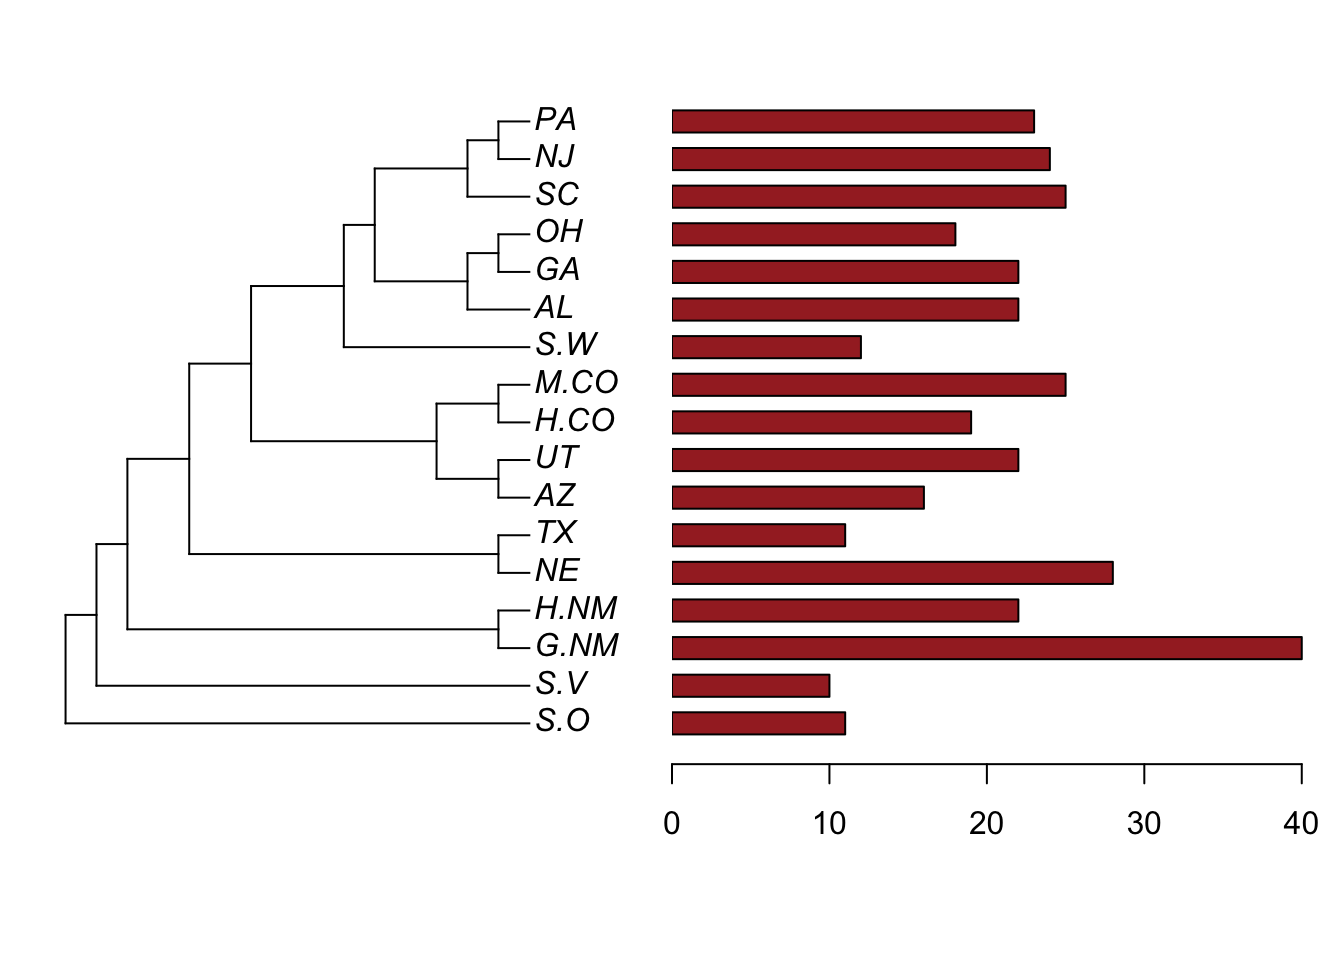
x<-traitset$EPY
names(x)<-tree$tip.label
x<-round(x)
plotTree.barplot(tree,x,args.barplot=list(col=sapply(x,function(x) if(x>=0) "brown" else "red"),xlim=c(0,max(x))),width = 5)